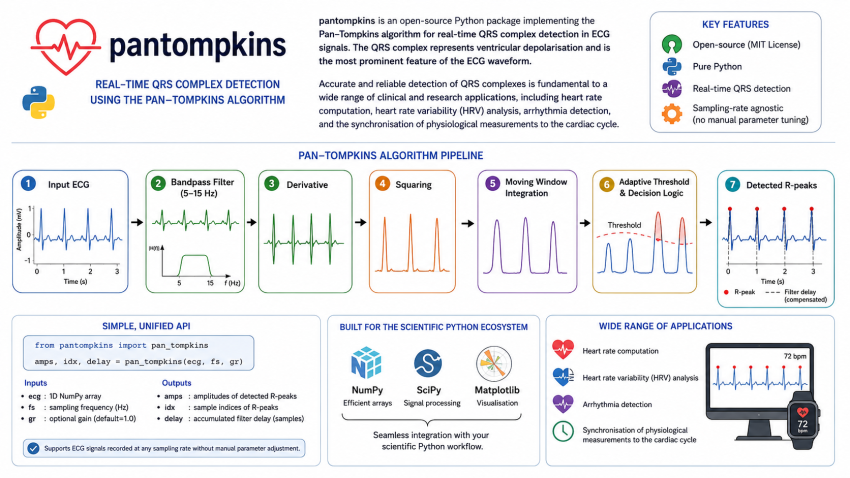
Looking for a Pan-Tompkins Python implementation for ECG QRS detection? This article provides an open-source, pip-installable implementation of the Pan-Tompkins algorithm, with practical examples showing how to detect QRS complexes and R-peaks from ECG signals.
The implementation is available as the pantompkins Python package and on GitHub.
Quick start: install the package with pip install pantompkins, pass a 1-D ECG signal and its sampling frequency to the detector, and use the returned R-peak indices for heart-rate and HRV analysis.
Quick Start
Installation
pip install pantompkinsBasic usage
import numpy as np
from pantompkins import pan_tompkins

# Load your ECG — any 1-D NumPy array
ecg = np.loadtxt("my_ecg.csv")
fs  = 360  # sampling frequency in Hz

qrs_amp, qrs_idx, delay = pan_tompkins(ecg, fs, gr=True)

print(f"Detected {len(qrs_idx)} QRS complexes")
print(f"R-peak times: {qrs_idx / fs} seconds")

# Compute instantaneous heart rate
rr   = np.diff(qrs_idx) / fs        # RR intervals in seconds
hr   = 60 / rr                       # beats per minute
print(f"Mean HR: {hr.mean():.1f} bpm")
The detector takes a one-dimensional ECG signal and its sampling frequency and returns the detected R-wave amplitudes, R-peak sample indices, and the reported processing delay.
You can then use the detected R-peaks to calculate RR intervals and heart rate:
rr = np.diff(qrs_idx) / fs
heart_rate = 60 / rr

print(f"Mean heart rate: {heart_rate.mean():.1f} bpm")
For visualising the intermediate stages of the algorithm, enable the plotting option:
qrs_amp, qrs_idx, delay = pan_tompkins(ecg, fs, gr=True)The graphical mode displays the processing stages and detection results, which is useful for understanding, debugging, and teaching the algorithm.
What Is the Pan-Tompkins Algorithm?
The electrocardiogram (ECG) is one of the most information-rich signals in clinical medicine. Buried inside its characteristic waveform is the QRS complex (the sharp spike that marks each ventricular contraction) and detecting it reliably is the foundation of almost every automated cardiac analysis tool in existence, from hospital monitors to smartwatches. For 40 years, the algorithm of choice has been the one published by Jiapu Pan and Willis J. Tompkins in the IEEE Transactions on Biomedical Engineering (Volume BME-32, Issue 3, pages 230–236, in March 1985).
The Pan-Tompkins Algorithm is elegant, computationally light, and remarkably robust. There is just one problem for most researchers today: the most complete reference implementation is written in MATLAB, which is a proprietary software that costs upwards of $1,000 per year.
So I ported it. This post explains what the algorithm does, how I translated it into Python, and how you can use it in your own work right now.
Attribution: This Python implementation is a port of the MATLAB reference code by Hooman Sedghamiz (MSc Biomedical Engineering, Linköping University, 2018). All credit for the original implementation belongs to him. The underlying algorithm is due to Pan & Tompkins (IEEE Trans. Biomed. Eng., 1985).
Why Is the Pan-Tompkins Algorithm Important
Proposed in 1985, the Pan-Tompkins algorithm was designed for real-time QRS detection on hardware with severe memory and processing constraints. What is remarkable is that it achieves sensitivity and specificity above 99% on the MIT-BIH Arrhythmia Database, a benchmark that many modern deep learning models still struggle to beat convincingly.
The algorithm works by progressively transforming the raw ECG through five stages, each one making the QRS complex easier to distinguish from background noise, baseline wander, and the lower-amplitude P and T waves that surround it.
The Processing Pipeline
Bandpass filter (5–15 Hz)
Removes baseline wander below 5 Hz and high-frequency EMG noise above 15 Hz, leaving the QRS energy band intact.
Five-point derivative filter
Emphasises the steep upstroke of the QRS complex. The kernel is interpolated to match any sampling rate.
Pointwise squaring
Makes all values positive and nonlinearly amplifies large slopes, suppressing P and T waves relative to QRS peaks.
Moving-window integration (~150 ms)
Integrates the squared signal to produce a smooth envelope capturing the total energy of each QRS complex.
Adaptive dual-threshold decision logic
Two adaptive thresholds — one on the integrated signal, one on the filtered signal — classify each peak. A T-wave rejection rule and a search-back procedure handle edge cases.
Key Decisions in Porting to Python
Zero-phase filtering
The original MATLAB code uses filter(), which introduces phase delay. In Python I use scipy.signal.filtfilt() throughout, which applies the filter forward and backward to achieve zero-phase distortion. This simplifies delay accounting and produces cleaner results for analysis.
Sampling-rate adaptation
The derivative filter kernel in the original paper assumes 200 Hz. This port interpolates the kernel to match any input sampling rate, so the same function works correctly whether you are reading MIT-BIH data at 360 Hz, a wearable ECG at 256 Hz, or a clinical recorder at 500 Hz.
Package structure
Rather than a bare script, the port is structured as a proper installable Python package from PyPi with a full pytest test suite (16 tests across 5 classes).
Getting Started
Using data from PhysioNet
import wfdb
from pantompkins import pan_tompkins

# Stream record 100 from the MIT-BIH Arrhythmia Database
record = wfdb.rdrecord("100", sampfrom=0, sampto=10800, pn_dir="mitdb")
ecg    = record.p_signal[:, 0]   # Lead MLII
fs     = record.fs                 # 360 Hz

qrs_amp, qrs_idx, delay = pan_tompkins(ecg, fs, gr=True)
What’s Next
The current release (v1.0.0) is a faithful port of the original algorithm. Planned improvements include a quantitative benchmark against the full MIT-BIH database with sensitivity, specificity, and F1 score, and a comparison against other open-source detectors. Contributions and issues are welcome on GitHub.
Links
- GitHub repository: github.com/Hatem-Zehir/pan-tompkins-qrs-detector
- Original MATLAB implementation: mathworks.com/matlabcentral/fileexchange/45840-complete-pan-tompkins-implementation-ecg-qrs-detector
- Reference paper: https://doi.org/10.1109/TBME.1985.325532